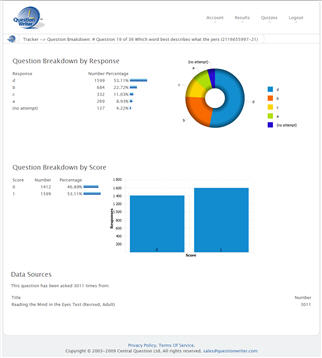
Question Writer Tracker now allows you to visualize the data from your questions. You can view the volume of responses as a pie chart and the scores achieved as a bar chart. This visualization gives you an easy way to see how people are responding and scoring on any given question.
-
Recent Posts
Categories
Monthly Archive